In the high-speed world of cryptocurrency, prices don’t just move; they teleport. Bitcoin can drop $1,000 in minutes, and altcoins can rally 20% while you are making coffee. For a day trader, trying to navigate this volatility without understanding price action is like trying to read a book in a language you don’t speak.
Candlestick charts are that language. They are not just lines on a screen; they are a visual representation of mass psychology—fear, greed, panic, and conviction. Unlike the stock market, which closes at night, the crypto market is a 24/7 battlefield. This makes reading candlesticks even more critical, as algorithms and global traders leave clues in the charts around the clock.
If you are tired of getting “faked out” by sudden pumps or dumps, this guide will teach you how to interpret the story behind every candle.
The Anatomy of a Crypto Candle: Decoding the Wicks
Before recognizing patterns, you must understand the raw data. A candlestick tells you four things about price over a specific time period:
- Open: The price when the candle started.
- Close: The price when the candle finished.
- High: The highest price reached.
- Low: The lowest price reached.
The body of the candle (the colored block) tells you the strength of the move. A large green body means buyers were in total control. A large red body means sellers dominated.
The “Wick” (Shadow) is Everything
In cryptocurrency, the wick—the thin line sticking out of the body—is often more important than the body itself.
- Long Upper Wick: This indicates Rejection. Buyers tried to push the price up, but sellers (or “whales”) slammed it back down. This is bearish.
- Long Lower Wick: This indicates Buying Pressure. Sellers tried to crash the price, but buyers stepped in aggressively to “buy the dip.” This is bullish.
Pro Tip: In crypto, long wicks often represent “liquidity grabs.” Algorithms push price below a support level to trigger stop-losses (creating a long wick) before reversing the direction.
The “Power 3” Single Candle Patterns
These single-candle formations provide immediate feedback on market sentiment.
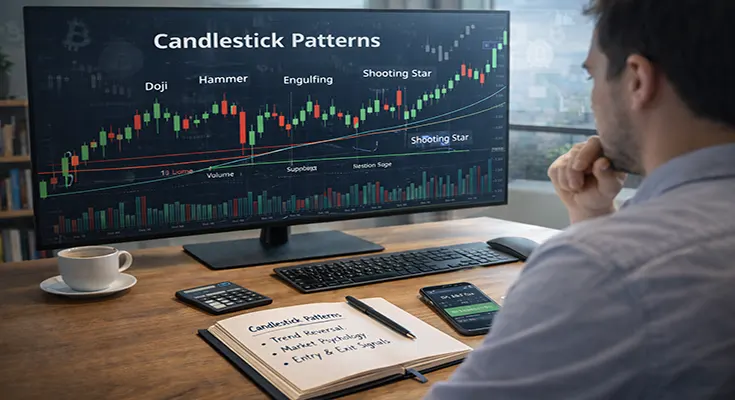
1. The Hammer (Bullish Reversal)
A Hammer forms at the bottom of a downtrend. It has a small body and a long lower wick (at least twice the size of the body).
- The Story: Bears tried to push the price to a new low, but bulls overwhelmed them and closed the price near the open.
- Action: Look for this at a Support level. It suggests the downtrend is exhausted.
2. The Shooting Star (Bearish Reversal)
The opposite of the Hammer. It forms at the top of an uptrend, featuring a small body and a long upper wick.
- The Story: Buyers pushed price up, but ran into a wall of sell orders. The market rejected the higher price.
- Action: If you are long on a coin and see this pattern at a Resistance level, it is a strong signal to take profits or consider a short position.
3. The Doji (Indecision)
A Doji looks like a cross. The Open and Close prices are almost virtually the same, leaving no “body.”
- The Story: A brutal fight occurred between bulls and bears, but nobody won. The market is confused.
- Action: A Doji signals a potential pivot. If seen after a massive “Green God Candle,” it often indicates the momentum is dying and a reversal is imminent.
Multi-Candle Patterns for Day Traders
Single candles are useful, but combining two or three candles gives you a “confirmation” signal.
Bullish & Bearish Engulfing
This is one of the most powerful patterns in crypto.
- Bullish Engulfing: A small red candle is followed immediately by a massive green candle that completely “swallows” (engulfs) the previous red candle’s body. This screams that buyers have taken full control.
- Bearish Engulfing: A small green candle is followed by a massive red candle. This indicates panic selling has begun.
Tweezer Tops & Bottoms
- Tweezer Bottoms: Two candles back-to-back with the exact same low point (long lower wicks touching the same price). This shows a “double floor” where buyers refused to let the price drop further.
- Tweezer Tops: Two candles with the exact same high point. This is a double rejection of a price ceiling.
Context is King: Avoiding the Fakeout
This is where beginners lose money. They spot a “Hammer” and instantly buy. Do not do this.
A candlestick pattern is only as good as its location.
- A Hammer in the middle of a sideways range is noise.
- A Hammer at a major Support level is a trade setup.
The Volume Confirmation
Crypto is notorious for “fakeouts.” A candle might look bullish, but if there is no volume behind it, the move is hollow.
- The Rule: If you see a breakout candle or a reversal candle, look at the Volume indicator at the bottom of your chart. Is the volume bar tall?
- Low Volume Reversal: Suspect a trap.
- High Volume Reversal: The “Smart Money” is participating. This is a valid entry.
Choosing Your Timeframes
In crypto day trading, choosing the wrong timeframe can be fatal.
- 1-Minute Chart: Too much noise. Avoid this unless you are an expert scalper using bots.
- 15-Minute Chart: The “sweet spot” for day trading entries. This is where you look for your candlestick patterns (Hammers, Engulfing).
- 1-Hour & 4-Hour Charts: Use these to determine the Trend Direction.
- Strategy: If the 4-Hour chart is in an uptrend, ignore bearish candles on the 15-minute chart. Only look for bullish candlestick patterns on the 15-minute chart to join the major trend.
Basically, reading candlestick charts is not about predicting the future with 100% accuracy; it is about probability. It is about seeing a Shooting Star at resistance and thinking, “The probability of price going up is now lower than the probability of it going down.”
To master this:
- Memorize the “Power 3” patterns.
- Always check the context (Support/Resistance).
- Confirm with Volume.
Don’t rush. The crypto market is open 24 hours a day, 7 days a week. The next opportunity is always just a few candles away. Open your charts, observe the wicks, and let the price tell you what to do.